Mastering Progress: A Guide to the Circle Dot Infographic Chart Design Set
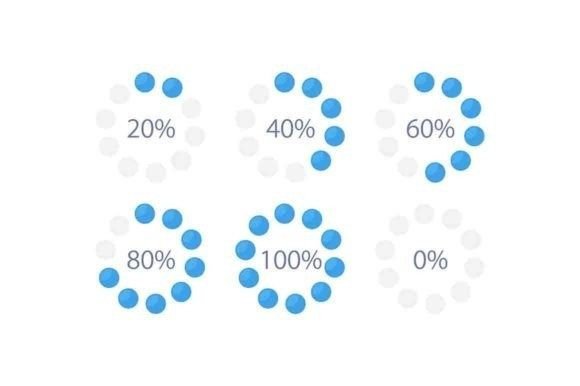
In the rush to communicate data clearly, many creators, from marketers to educators, turn to infographic templates. The Circle Dot Infographic Chart Design Set represents a popular and versatile choice, offering six editable circular diagram templates focused on progress and completion. Its appeal is obvious: ready-made, professional designs that promise to save time and elevate presentations. Yet, the path from download to a successful, impactful visual is often littered with small, avoidable errors that undermine the entire effort. Understanding these pitfalls—and how to navigate them—is the key to unlocking the true value of this design collection.
The Common Rush: Choosing Form Over Function
A frequent mistake is selecting the Circle Dot Infographic Chart Design Set purely for its aesthetic. The clean circles and dotted segments are visually appealing, leading many to download the files without first considering if the structure matches their data's story. For instance, a template designed to show five stages of a project is ill-suited for representing ten quarterly revenue metrics. The result is a forced, confusing chart that obscures meaning rather than clarifying it. Before downloading, always audit your data. Ask: What is the core relationship I need to show? Is it progression, completion, comparison, or variety? Match the template’s innate logic to your narrative.
Ignoring the Power of Editability
The set is promoted as editable, with files in EPS, AI, SVG, and PNG formats. However, beginners often treat the JPEG or PNG files as final products, simply dropping them into presentations. This locks them into the default colors, fonts, and segment counts, making their infographic look generic and indistinguishable from others using the same set. The true value lies in the vector files (EPS, AI, SVG). Opening them in a tool like Adobe Illustrator or even a free alternative like Inkscape allows you to customize every element. Change the dot colors to align with your brand palette, adjust the font to improve readability, or even modify the number of segments to fit your specific data points. This customization transforms a template into your own unique visual asset.
File Format Confusion and Its Consequences
The product includes files on both white and transparent backgrounds. A common oversight is using a PNG with a white background on a colored slide, creating a jarring white rectangle. Conversely, using a transparent-background SVG on a simple white document might be unnecessary. Each format serves a purpose. For digital reports or web graphics, the PNG or SVG on a transparent background offers seamless integration. For print materials like the vector brochures the designers mention, the EPS or JPEG on white might be more suitable. Always check your final output medium before choosing which file to download and use. This small decision dramatically affects the professionalism of the final layout.
The Subscription Trap: New Graphics Without a Plan
The offer to subscribe for new graphics every week is enticing, but it can lead to a clutter of unused assets. Professionals and hobbyists alike often subscribe with enthusiasm, amassing a library of templates they never deploy. This not only represents a potential ongoing cost but also creates decision paralysis—too many choices. A better approach is to evaluate your actual needs. Does your work require weekly infographic updates? If not, the core Circle Dot Infographic Chart Design Set might be sufficient. If you do subscribe, implement a system: categorize new downloads by project type and dedicate time to customize one template immediately, ensuring it becomes a practical tool, not just a stored file.
Overlooking the "Set" in the Design Set
Many users look at the Circle Dot Infographic Chart Design Set as six isolated templates. This is a misunderstanding. The set is designed as a cohesive family of visuals. A powerful yet overlooked application is using multiple templates from the same set across a single report or presentation. For example, use one circular diagram to show overall project completion, another to break down task realization per department, and a third to display skill variety within the team. This creates a consistent, reinforced visual language that strengthens your communication. It tells your audience that the data is part of a unified story, curated with care.
A related error is failing to consider scale and context. An infographic meant for a social media post needs to be simple and bold. The same chart in a detailed annual report might need finer labels and more subdued colors. The editable nature of the set allows for this adaptation, but you must consciously make those adjustments. Don't let the default design dictate your context.
Practical Steps Before You Begin
To avoid these common issues, adopt a simple checklist before using the Circle Dot Infographic Chart Design Set. First, define your data and audience. Know exactly what numbers or concepts you're visualizing and who needs to understand them. Second, preview all six templates against your data narrative. Choose the one that fits, not the one you like the most. Third, verify your software. Can you open and edit EPS or AI files? If not, ensure you have a tool that can handle SVG for customization. Fourth, plan your integration. Decide where the graphic will live—a website, printed brochure, PowerPoint—and select the appropriate file format (transparent or white background) accordingly. Finally, customize with purpose. Modify colors, fonts, and text to align with your project's branding and tone.
From Template to Effective Communication
The ultimate goal of any infographic, including those from this circle dot collection, is to make complex information instantly accessible. The mistakes outlined often stem from treating the template as a finished product rather than a starting tool. By investing a small amount of time in strategic selection and thoughtful customization, you leverage the design set's full potential. You create visuals that not only look professional but also function perfectly within your specific communication ecosystem. This transforms your work from a generic chart into a compelling part of your story, enhancing reports, pitches, blogs, and educational materials with clarity and impact. Remember, the design set provides the structure; your data and care provide the meaning.